Training an Ocropus OCR model
In the last post, we walked through the steps in the Ocropus OCR pipeline. We extracted text from images like this:
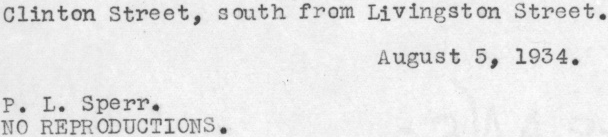
The results using the default model were passable but not great:
O1inton Street, aouth from LIYingston Street.
Auguat S, 1934.
P. L. Sperr.
NO REPODUCTIONS.
Over the larger corpus of images, the error rate was around 10%. The default model has never seen typewriter fonts, nor has it seen ALLCAPS text, both of which figure prominently in this collection. So its poor performance comes as no surprise.
In this post I’ll walk through the process of training an Ocropus model to recognize the typewritten text in this collection. By the end of this post, the performance will be extremely good.
Generating truth data
Ocropus trains its model using supervised learning: it requires
images of lines along with correct transcriptions. If you’re trying to
recognize a known font, you can generate arbitrary amounts of labeled data
(using ocropus-linegen). But in our case, we have to label some images by
hand.
This is tedious and involves a lot of typing. Amazon’s Mechanical Turk is a popular way of farming out small tasks like this, but I prefer to do the transcription myself using localturk. It doesn’t take as long as you might think (I typed 800 lines in about an hour and 20 minutes). And it has the benefit of forcing you to look at a large sample of your data, something that’s likely to lead to insights.
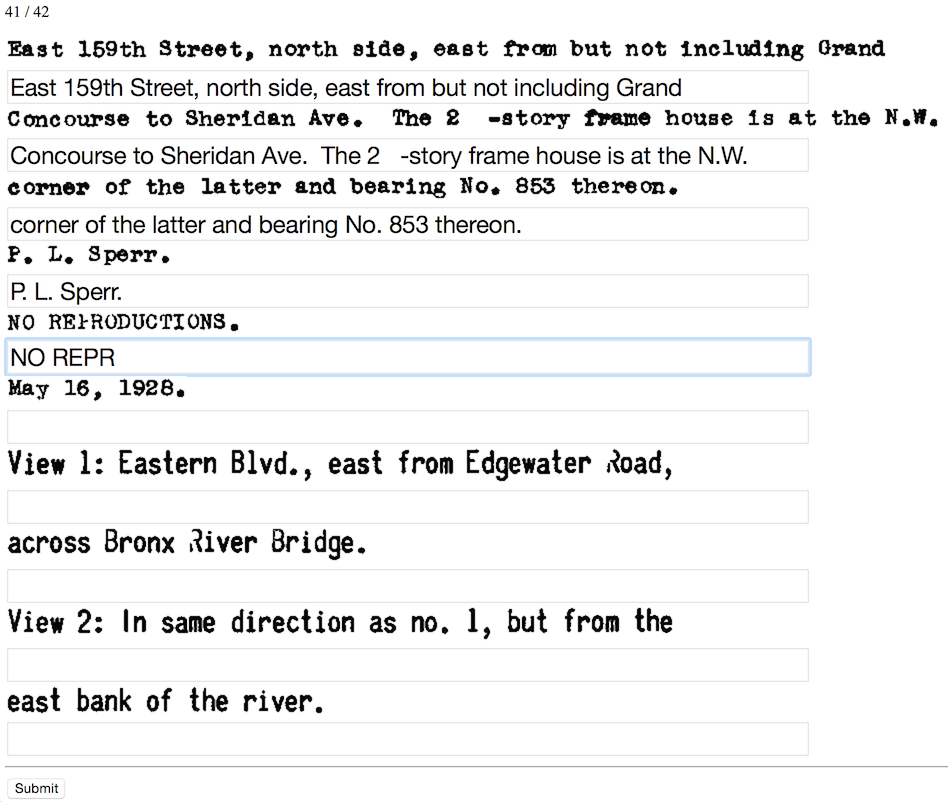
(localturk in action)
I used this template for the transcription. Ocropus expects truth
data to be in .gt.txt files with the same name as the PNG files for the
lines. For example:
book/0001/010001.pngbook/0001/010001.gt.txt
It’s important that you transcribe lines, not entire pages. I initially transcribed pages and tried to have Ocropus learn on them, but this doesn’t work at all.
Training a model
Ocropus trains a model by learning from its mistakes. It transcribes the text in a line, then adjusts the weights in the Neural Net to compensate for the errors. Then it does this again for the next line, and the next, and so on. When it gets to the last line of labeled data, it starts over again. As it loops through the training data over and over again, the model gets better and better.
ocropus-rtrain -o modelname book*/????/*.bin.png
This produces lots of output like this:
2000 70.56 (1190, 48) 715641b-crop-010002.png
   TRU: u'504-508 West 142nd Street, adjoining and west of Hamilton'
   ALN: u'504-5088 West 422nd Street, adjoining and west of Hammilton'
   OUT: u'3od-iS est 4nd Street, doning nd est of Sarilton'
2001 32.38 (341, 48) 726826b-crop-010003.png
   TRU: u'NO REPRODUCTIONS'
   ALN: u'NO REPRODUCTIONS'
   OUT: u'sO EROCoOri'
...
TRU is the truth data. OUT is the output of the model. ALN is a variant
of the model output which is aligned to the truth data. It’s used to adjust
the model weights more precisely. It typically looks better than the model
output, especially in early iterations. It lets you know that you’re making
progress.
Here’s a video that Thomas, the Ocropus developer, put together. It shows the network’s output for a single image as it learns (see the YouTube page for explanations of the different charts):
For my first model, I used 400 of the labeled lines as training data and held out the other 400 as test data. Ocropus saves models to disk every 1000 iterations, so it’s simple to evaluate the model’s performance as it learns:
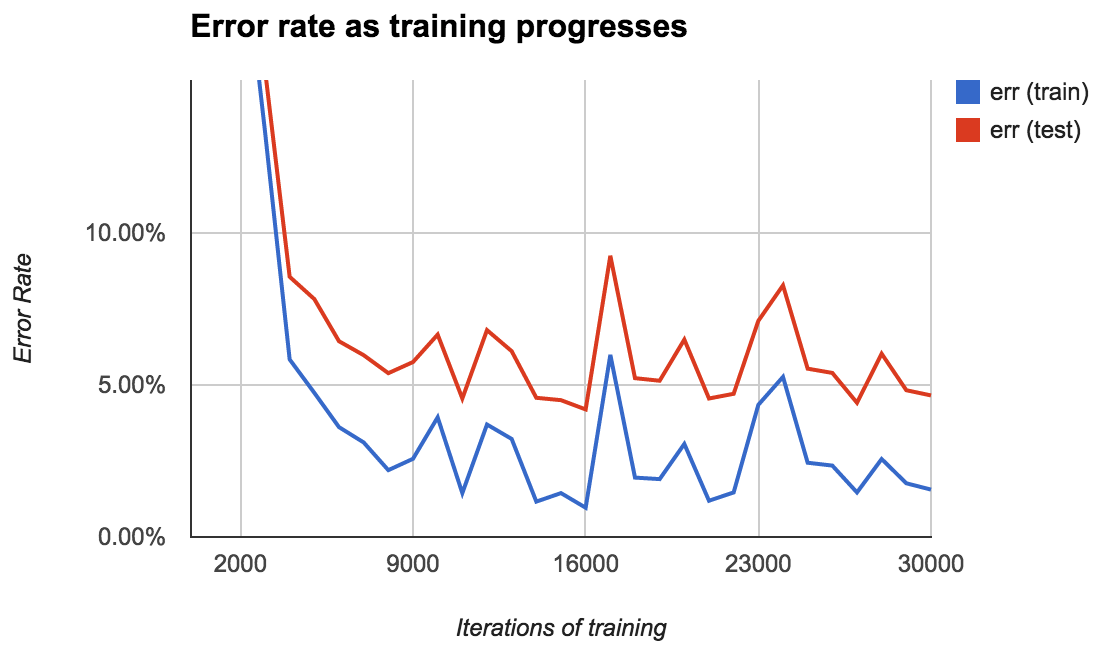
The error rate starts high (over 50%) but quickly comes down to about 2% after 10,000 iterations, eventually hitting a minimum of 0.96% at 16,000 iterations.
The error rate on the test set is consistently about 3% higher than that on the training set. The best error rate on the test set was 4.20%.
There’s a lot of variation in the error rate. You might expect it to slowly decrease over time, but that’s not at all the case. I’m not quite sure how to interpret this. Does the error rate spike at 17,000 iterations because the model tries to jolt itself out of a local minimum? Is it just randomness?
In any case, it’s important to generate a chart like this. Choosing the wrong model could lead to needlessly bad performance.
Training with more data.
You’d expect that training on more data would yield a better model. So for my next model, I trained on all 800 labeled images (rather than just 400). I didn’t have a test set. Here’s what the error rate looked like:
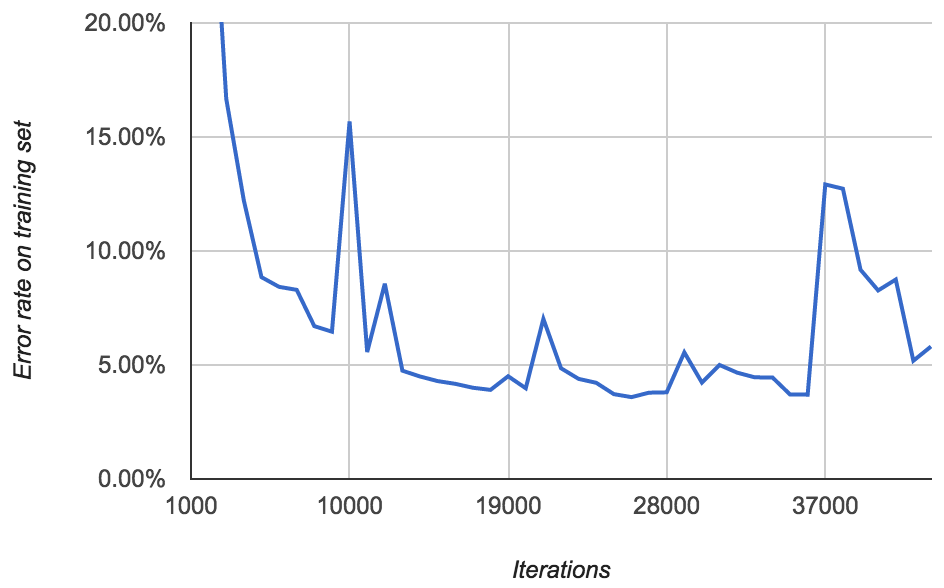
This doesn’t make much sense to me. The lowest error rate on the 800 training images is 3.59%. But the model from the previous section achieved an error rate of 2.58% on the same data set (average of 0.96% and 4.20%). And it only saw half the data! How is that possible? Maybe this model just had bad luck.
There’s the same pattern as before of occasional spikes in error rate. More disturbing, after around 40,000 iterations, I started seeing lots of FloatingPointErrors. It’s unclear to me exactly what this means. Perhaps the model is diverging?
Here’s another model that I trained for even longer:
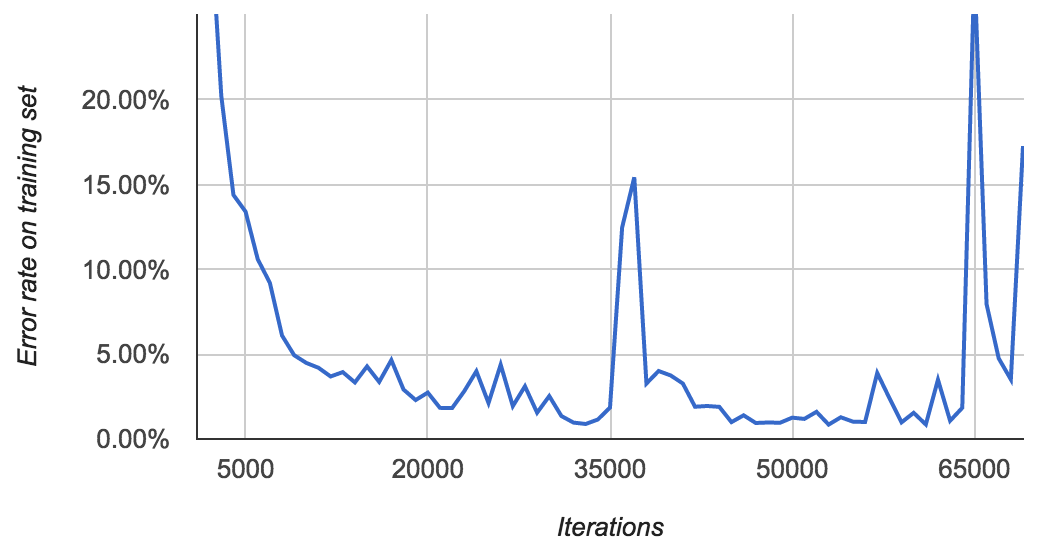
It achieves an error rate of 0.89% at iteration 33,000, then spikes to over
15% at 37,000. It eventually gets back down to 0.85% after 53,000 iterations,
then starts spiking again. By the time I stopped it, I was again seeing lots
of FloatingPointErrors.
The point of all this is that the error rates are quite erratic, so you need to look at them before choosing which model you use!
Training with the default model
So far we’ve built our models from scratch. But you can also build on top of an existing model.
Even though it’s never seen typewriter text or ALLCAPS, the default Ocropus model presumably knows a lot about Latin characters and the relationship between them in English words. And I trust the Ocropus developers to build a good Ocropus model far more than I trust myself.
You train on top of an existing model using the --load option:
ocropus-rtrain --load en-default.pyrnn.gz -o my-model *.png
Here’s what the error rate looks like:
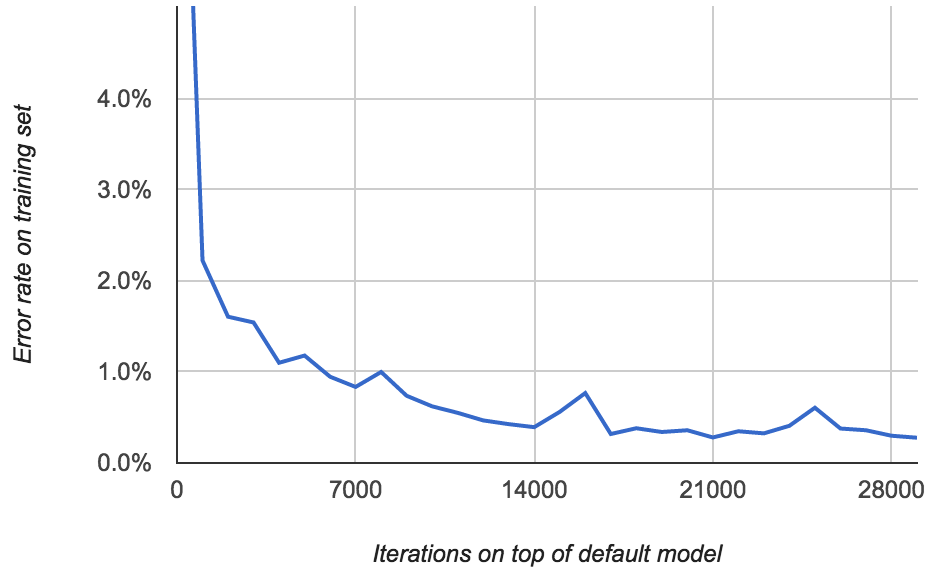
Now we’re getting somewhere: the error rate gets all the way down to 0.277%!
Something interesting happens when you get the error rate significantly below 1%. The “mistakes” that the model makes are quite likely to be errors that you made while transcribing truth data! I noticed that I misspelled some words and even hallucinated new words like “the” into some of the lines.
Even crazier, there were typos in the original images that I subconsciously corrected:
(Look at the second to last word.)
A model with a 0.2% error rate is good enough to produce readable text. For example, here’s what it produces for the image from the last post:
![]()
→ Clinton Street, south from Livingston Street.
![]()
→ P. L. Sperr.
![]()
→ NO REPRODUCTIONS.
![]()
→ August 5, 1934.
i.e. it’s perfect. Here’s the output of the Neural Net for the last line:
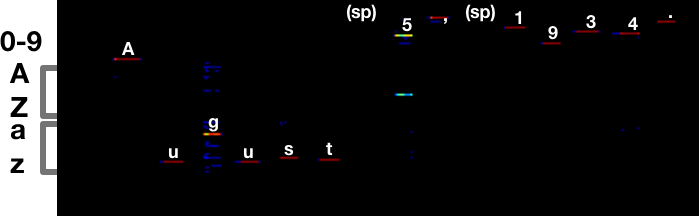
Compare that to what it was before:
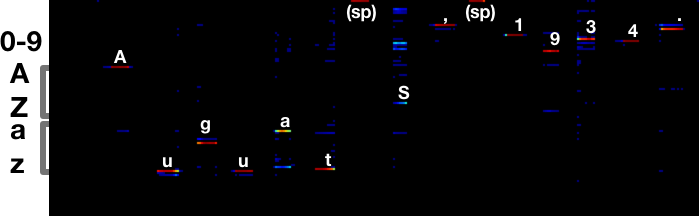
There’s still some ambiguity around 5/S, but it makes the right call. The
a vs s error is completely gone.
Conclusions
At this point the model is good enough. If I were to improve it further, I’d either improve my image cropper or incorporate some kind of spell checking as a post-processing step.
The behavior of the models as they’re trained is sometimes inscrutable. Finding a good one involves a lot of trial and error. To avoid flailing, measure your performance constantly and keep a list of ideas to explore. “Train a model starting with the pre-built one” was item #6 on my list of ideas and it took me a while to get around to trying it. But it was the solution!
If you’re feeling lost or frustrated, go generate some more training data. At least you’ll be doing something useful.
At the end of the day, I’m very happy with the OCR model I built. Ocropus has some rough edges, but it’s simple enough that you can usually figure out what’s going on and how to fix problems as they come up. And the results speak for themselves!
Please leave comments! It's what makes writing worthwhile.
comments powered by Disqus